많은 분들이 배당주에 관심이 많습니다. 제 경우에는 포트의 80프로 정도를 몇몇 대표 성장주, 가치주에 집중하고 있고, 그 중에서 또 7:3 비율로 미국주식, 한국주식에 투자하고 있습니다. 남은 20프로 정도는 배당주에 투자하려고 하는데요, 현재는 유명 배당주인 AT&T(T)와 Exxon(XOM), 그리고 캐나다 리츠주인 PROREITS(PRV.UN)에 투자하고 있고 현재의 기대 배당 수익은 연 300만원 정도입니다.
오늘은 제가 가지고 있는 소형리츠인 PRV.UN과 비슷하지만 규모는 10배 차이 나는 심볼 GNL, Global Net Lease라는 회회사에 대해서 알아보겠습니다. (최초 작성일 2020년 10월 16일)
GNL


52주 최고가는 $21.71, 52주 최저가는 $8.77입니다. 현재 Market Cap은 14억 달러, 한화로는 1조 6천억입니다. 작년 10월 정도에 롯데리츠(330590)가 시총 1조 1천억(현재 9천억)정도입니다.
기업 소개
글로벌 넷 리스는, 부동산 투자 회사 신탁 회사입니다. 이 회사는 다각화된 글로벌 상업용 부동산 자산 포트폴리오, 특히 미국과 서/북부 유럽의 "sale-and-leaseback transactions", 주로 Single Tenant와 함께 하는 리스백 거래, 또는 미션 크리티컬(비즈니스 운영에 필수적인)한 성격을 가진 net-계약으로 수입을 만드는 것에 집중합니다. 또한 이 회사는 일반적인 부동산 취득과 임대 사업도 진행합니다. 이 회사는 부동산 투자 부문에서만 운영됩니다. 현재 이 회사는 34.6 million sqft(10만평)이 넘는 약 296개의 부동산 자산을 소유하고 있습니다. 또한 First mortgage loans, Mezzanin loans, preffered equity or securitized loans을 시행하거나 구입할 수 있습니다.
First mortgage loans
채무 불이행 상태일 때 첫번째로 담보권을 행사 할 수 있는 모기지.
한국에서의 주택담보대출
Mezzanin loans
메자닌 론, 담보대출과 신용대출 사이의 어느 곳에 있는 대출
Preffered equity or securitized loans
우선주 또는 담보 자산화 대출(채권)

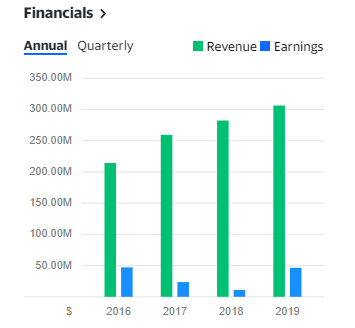
Income Statement
| Items (USD) | 2015 | 2016 | 2017 | 2018 | 2019 |
| Total Revenue | 205.33M | 214.17M | 259.3M | 282.21M | 306.21M |
| - Cost of Revenue | 33.35M | 38.79M | 53.31M | 56.97M | 61.61 |
| Gross Profit | 171.99M | 175.38M | 205.98M | 225.24M | 244.61M |
| Marketing and Administrative Expenses | 9.52M | 10.86M | 4.86M | 13.09M | 19.64M |
| Total Operating Expense | 172.12M | 153.89M | 173.25M | 212.33M | 215.88M |
| Operationg Income | 33.21M | 60.28M | 86.05M | 69.87M | 90.33M |
| Interest Income | 35M |
34M |
42M |
54M |
62M |
| Asset Disposal | - | 13.34M | 1.09M | -5.75M | -23.62M |
| Other Non-operating Net Income | 79.00K | 20.00K | 22.00K | -23.00K | 216.00K |
| Non-operating Income | -29.42M | -8.28M | -59.32M | -56.54M | -39.52M |
| Net Income Before Taxes | 3.87M | 52M | 26.73M | 13.33M | 50.81M |
| Minority Interests | -50K | -437K | -21K | 0 | 0 |
| Net Income | -2.02M | 47.58M | 23.59 | 10.9M | 46.48M |
| Minority Interest | 50K (2398억원) |
440K (2398억원) |
21K (2398억원) |
0 | 0 |
| Net Income Attributable to Shareholders | -2.06M | 47.14M | 23.57M | 10.90M | 46.48M |
| Net Income Attributable to Common Equities | -2.51M | 46.37M | 19.99M | 393K | 33.88M |
| Diluted EPS | -0.04 | 0.82 | 0.30 | 0.01 | 0.39 |
Balance Sheet
| Items (USD) | 2015 | 2016 | 2017 | 2018 | 2019 |
| Cash and Cash Equivalents | 69.94M | 69.83M | 102.42M | 100.32M | 270.30M |
| Short-term Investments | - | - | - | - | - |
| Short-term Investments |
- | - | - | - | - |
| Accounts Receivable | 136.00K | 35.61M | - | - | - |
| Notes Receivable | - | - | - | - | - |
| Interest Receivable | - | - | - | - | - |
| Other Receivables | 136.00K | 35.61M | 42.76M | 47.20M | 52.15M |
| Prepayments | - | - | - | - | - |
| Inventories | - | - | - | - | - |
| Holding Assets for Sale | - | - | - | - | - |
| Unamortized Expenditures | - | - | - | - | - |
| Other Current Assets | - | - | - | - | - |
| Total Current Assets | 70.07M | 105.44M | - | - | - |
| - Fixed Assets Net | 2.41B | 2.72B | 2.83B | 2.98B | 3.30B |
| - Long-term Receivables | - | - | - | - | - |
| - Long-term Investments | - | - | - | - | - |
| - Deferred Tax Asset | - | - | - | - | - |
| - Goodwill | - | - | - | - | - |
| - Intangible Assets | 2.99M | 13.93M | 22.77M | 22.18M | 21.92M |
| - Long-term Deferred Expenses | - | - | - | - | - |
| - Other Non-current Assets | 10.28M | 10.18M | 13.11M | 125.88M | 19.36M |
| Total Non-current Assets | 2.54B | 2.89B | 3.04B | 3.31B | 3.70B |
| Total Assets | 2.89B | 2.89B | 3.04B | 3.31B | 3.70B |
| - Short/Current Long Term Debt | - | - | - | - | - |
| - Accounts Payable | - | - | - | - | - |
| - Notes Payable | 0.00 | 55.40M | 0.00 | 0.00 | 0.00 |
| - Taxes and Dues Payable | - | - | - | - | - |
| - Salary Payable | - | - | - | - | - |
| - Financing Expenses Payable | - | - | - | - | - |
| - Other Payable | 18.66M | 22.86M | 23.23M | 31.53M | 22.90M |
| - Advance Receipt | - | - | - | - | - |
| - Accrued Expenses | - | - | - | - | 23.98M |
| - Deferred Income | - | - | - | - | - |
| - Holding Liabilities For Sale | - | - | - | - | - |
| - Financial Derivative Liabilities | - | - | - | - | - |
| - Other Current Liabilities | 6.01M | 11.26M | 5.86M | 5.68M | 5.39M |
| Total Current Liabilities | 24.67M | 706.13M | 328.00M | - | - |
| - Long-term Debt | 1.24B | 1.37B | 1.51B | 1.77B | 1.87B |
| - Long-term Payables | - | - | - | - | - |
| - Long-term Deferred Income | - | - | - | - | - |
| - Long-term Deferred Tax Liabilities | 4.02M | 15.06M | 15.86M | 15.23M | 14.97M |
| - Other Non-current Liabilities | 50.17M | 64.41M | 65.71M | 55.87M | 55.27M |
| Total Non-current Liabilities | 1.34B | 1.54B | 1.63B | 1.88B | 2.00B |
| Total Liabilities | 1.32B | 1.54B | 1.62B | 1.88B | 1.99B |
| - Common Stocks | 1.69M | 1.99M | 2.00M | 2.09M | 2.23M |
| - Additional Paid-in Capital | 1.48B | 1.71B | 1.86B | 2.03B | 2.41B |
| - Retained Earnings | -272.81M | -346.06M | -468.40M | -615.45M | -733.25M |
| - Treasury Shares | - | - | - | - | - |
| - Other Equity Instruments | - | - | - | - | - |
| - Minority Interest | 14.73M | 8.20M | 1.08M | 3.26M | 12.33M |
| Equities Attributable to Parent Company | 1.21B | 1.35B | 1.41B | 1.43B | 1.70B |
| Total Equities | 1.22B | 1.36B | 1.41B | 1.43B | 1.71B |
| Total Liabilities and Equities | 2.54B | 2.89B | 3.04B | 3.31B | 3.70B |
Cash Flow
| Items | 2015 | 2016 | 2017 | 2018 | 2019 |
| Net Income | -2.02M | 47.58M | 23.59M | 10.90M | 46.48M |
| - Depreciation and Amortization | 90.07M | 94.45M | 113.05M | 119.58M | 126.00M |
| - Deferred Tax | -699.00K | 2.32M | 2.35M | -2.90M | -1.40M |
| - Unamortized Expenditures | - | - | - | - | - |
| - Accrued Expenses | - | - | - | - | - |
| - Share-based Compensation | - | - | - | - | - |
| - Assets Disposal | 1.47M | -24.93M | 5.26 | 11.78 | -3.88M |
| - Financial Expenses | - | - | - | - | - |
| - Investment Loss | - | - | - | - | - |
| - Working Capital Change | 13.33M | -5.03M | -13.30M | 5.24M | -21.20M |
| - Other Items | - | - | - | - | - |
| Operating Activities | 102.16M | 114.39M | 130.95M | 144.60M | 146.00M |
| - Purchases of Fixed Assets | -233.57M | -200.00K | -101.89M | -481.10M | -580.08M |
| - Proceeds from Disposal of Fixed Assets | - | - | - | - | - |
| - Investment Expenditure | - | - | - | - | - |
| - Investment Income | - | - | - | - | - |
| - Other Investing Activities | 11.29M | 134.35M | 22.92M | 23.16M | 285.60M |
| Investing Activities | -222.28M | 134.15M | -78.98M | -457.95M | -294.48M |
| - Issuance of Capital Stock | -126.84M | 0.00 | 148.73M | 171.54M | 117.67M |
| - Issuance of Bonds | 347.80M | -116.37M | -20.91 | 311.49 | 105.16 |
| - Proceeds from Borrowings | - | - | - | - | - |
| - Dividend Payments | -97.73M | -120.39M | -143.12M | -157.26 | -161.51M |
| - Repayment of Borrowings | - | - | - | - | - |
| - Buyback Payments | - | - | - | - | - |
| - Stock Incentive Compensation | - | - | - | - | - |
| - Other Financing Activities | - | - | - | - | - |
| Financing Activities | 118.82M | -236.70M | -30.66M | 312.19M | 300.00M |
| Effect of Exchange Rate Changes | 3.77M | -7.77M | 9.08M | -2.88M | 19.07M |
| Net Increase in Cash,Cash Equivalents | 2.47M | 4.07M | 30.40M | -4.03M | 170.59M |
잉여현금흐름(Free Cash Flow)
| Free Cash Flow | - | 114M | 128M | 143M | 129M |
댓글